Trinity Bank Reports 2021 3rd Quarter Net Income Of $1,476,000

*3^RD QUARTER RETURN ON ASSETS 1.49%*
*3^RD QUARTER RETURN ON EQUITY 14.15%*
*FORT WORTH, TX / ACCESSWIRE / October 27 2021 / *Trinity Bank N.A. (OTC PINK:TYBT) today announced operating results for the third quarter and the nine months ending September 30, 2021.
*Results of Operation*
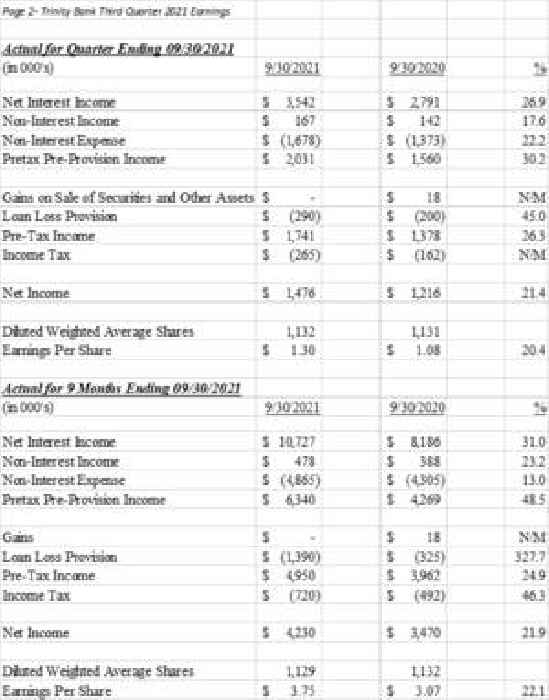
For the third quarter 2021, Trinity Bank, N.A. reported Net Income after Taxes of $1,476,000, an increase of 21.4% over third quarter 2020 earnings of $1,216,000. Earnings per diluted common share for the third quarter 2021 amounted to $1.30, an increase of 20.4% over third quarter 2020 results of $1.08 per diluted common share.
For the first nine months of 2021, Net Income after Taxes was $4,230,000, an increase of 21.9% over the first nine months of 2020 results of $3,470,000. Earnings per diluted common share for the first nine months of 2021 were $3.75, an increase of 22.1% over the first nine months of 2020 results of $3.07 per diluted common share.
Chairman Jeff Harp stated, "Trinity Bank and its customers have continued to make progress in 2021 in spite of price increases, supply chain issues, and political gridlock. We are cautiously optimistic that the headwinds from the pandemic are diminishing."
President Barney C. Wiley reported, "We continue to see increased activity in the local economy and increased opportunity for organic growth - both from our existing customers as well as prospective customers. The artificial low interest rate environment is a hindrance, but Trinity continues to produce above-peer performance in terms of Return on Assets, Return on Equity, Efficiency, and Capital Strength. In addition, on October 29, Trinity will pay its 20^th consecutive increased semiannual dividend. Total dividends for 2021 will be $1.42 representing an 8.4% increase over 2020 dividends of $1.31."
Trinity Bank, N.A. is a commercial bank that began operations May 28, 2003. For a full financial statement, visit Trinity Bank's website: www.trinitybk.com Regulatory reporting format is also available at www.fdic.gov.
*For information contact:*
Richard Burt
Executive Vice President
Trinity Bank
817-763-9966
This Press Release may contain certain forward-looking statements within the meaning of the Private Securities Litigation Reform Act of 1995 regarding future financial conditions, results of operations and the Bank's business operations. Such forward-looking statements involve risks, uncertainties and assumptions, including, but not limited to, monetary policy and general economic conditions in Texas and the greater Dallas-Fort Worth metropolitan area, the risks of changes in interest rates on the level and composition of deposits, loan demand and the values of loan collateral, securities and interest rate protection agreements, the actions of competitors and customers, the success of the Bank in implementing its strategic plan, the failure of the assumptions underlying the reserves for loan losses and the estimations of values of collateral and various financial assets and liabilities, that the costs of technological changes are more difficult or expensive than anticipated, the effects of regulatory restrictions imposed on banks generally, any changes in fiscal, monetary or regulatory policies and other uncertainties as discussed in the Bank's Registration Statement on Form SB‑1 filed with the Office of the Comptroller of the Currency. Should one or more of these risks or uncertainties materialize, or should these underlying assumptions prove incorrect, actual outcomes may vary materially from outcomes expected or anticipated by the Bank. A forward-looking statement may include a statement of the assumptions or bases underlying the forward‑looking statement. The Bank believes it has chosen these assumptions or bases in good faith and that they are reasonable. However, the Bank cautions you that assumptions or bases almost always vary from actual results, and the differences between assumptions or bases and actual results can be material. The Bank undertakes no obligation to publicly update or otherwise revise any forward‑looking statements, whether as a result of new information, future events or otherwise, unless the securities laws require the Bank to do so.
TRINITY BANK N.A.
(Unaudited)
(Dollars in thousands, except per share data)
*Quarter Ended* *Nine Months Ending* *September 30* *%* *September 30* *%*
*EARNINGS SUMMARY*
*2021* *2020* *Change* *2021* *2020* *Change*
Interest income
$ 3,692 $ 2,949 25.2 % $ 11,153 $ 8,913 25.1 %
Interest expense
150 158 -5.1 % 426 727 -41.4 %
*Net Interest Income*
*3,542* *2,791* *26.9* *%* *10,727* *8,186* *31.0* *%*
Service charges on deposits
56 56 0.0 % 169 145 16.6 %
Other income
111 86 29.1 % 309 243 27.2 %
*Total Non Interest Income*
*167* *142* *17.6* *%* *478* *388* *23.2* *%*
Salaries and benefits expense
1,127 915 23.2 % 3,166 2,807 12.8 %
Occupancy and equipment expense
121 94 28.7 % 359 348 3.2 %
Other expense
430 364 18.1 % 1,340 1,150 16.5 %
*Total Non Interest Expense*
*1,678* *1,373* *22.2* *%* *4,865* *4,305* *13.0* *%*
*Pretax pre-provision income*
*2,031* *1,560* *30.2* *%* *6,340* *4,269* *48.5* *%*
Gain on sale of securities
N/M N/M
Gain on sale of foreclosed assets
18 N/M 18 N/M
Gain on sale of assets
N/M N/M
*Provision for Loan Losses*
*290* *200* *45.0* *%* *1,390* *325* *327.7* *%*
Earnings before income taxes
1,741 1,378 *26.3* *%* 4,950 3,962 *24.9* *%*
Provision for income taxes
265 162 N/M 720 492 *46.3* *%*
*Net Earnings*
*$* *1,476* *$* *1,216* *21.4* *%* *$* *4,230* *$* *3,470* *21.9* *%*
Basic earnings per share
1.36 1.12 *21.3* *%* 3.91 3.20 *22.1* *%*
Basic weighted average shares
1,086 1,084 1,083 1,085
outstanding
Diluted earnings per share - estimate
1.30 1.08 *20.4* *%* 3.75 3.07 *22.1* *%*
Diluted weighted average shares outstanding
1,132 1,131 1,129 1,132
*Average for Quarter* *Average for Nine Months*
*September 30* *September 30*
*BALANCE SHEET SUMMARY*
*2021* *2020* *%*
*Change* *2021* *2020* *%*
*Change*
Total loans
$ 222,400 $ 165,073 34.7 % $ 214,470 $ 168,203 27.5 %
Total PPP loans
$ 27,071 $ 51,381 -47.3 % $ 43,325 $ 31,142 39.1 %
Total short term investments
26,122 32,176 -18.8 % 22,017 37,152 -40.7 %
Total investment securities
113,914 92,272 23.5 % 101,540 82,889 22.5 %
*Earning assets*
*389,507* *340,902* *14.3* *%* *381,352* *319,386* *19.4* *%*
*Total assets*
*395,762* *342,058* *15.7* *%* *387,645* *326,806* *18.6* *%*
Noninterest bearing deposits
143,056 117,655 21.6 % 140,044 111,353 25.8 %
Interest bearing deposits
207,369 189,053 9.7 % 203,647 175,504 16.0 %
*Total deposits*
*350,425* *306,708* *14.3* *%* *343,691* *286,857* *19.8* *%*
Fed Funds Purchased and Repurchase Agreements
N/M 81 N/M
*Shareholders' equity*
*$* *41,723* *$* *37,602* *11.0* *%* *$* *40,390* *$* *36,866* *9.6* *%*
TRINITY BANK N.A.
(Unaudited)
(Dollars in thousands, except per share data)
*Average for Quarter Ending*
*Sept. 30,* *June 30,* *March 31,* *Dec 31,* *Sept. 30,*
*BALANCE SHEET SUMMARY*
*2021* *2021* *2021* *2020* *2020*
Total loans
$ 222,400 $ 214,501 $ 206,386 $ 188,361 165,073
Total PPP loans
27,071 $ 46,772 $ 56,454 $ 51,079 51,381
Total short term investments
26,122 28,242 11,131 23,960 32,176
Total investment securities
113,914 96,153 94,737 93,094 92,272
*Earning assets*
*389,507* *385,668* *368,708* *356,494* *340,902*
*Total assets*
*395,762* *391,571* *375,295* *363,558* *342,058*
Noninterest bearing deposits
143,056 136,853 133,541 130,114 117,655
Interest bearing deposits
207,369 211,012 199,047 191,654 189,053
*Total deposits*
*350,425* *347,865* *332,588* *321,768* *306,708*
Fed Funds Purchased and Repurchase Agreements
244
*Shareholders' equity*
*$* *41,723* *$* *40,236* *$* *39,352* *$* *38,084* *$* *37,602*
*Quarter Ended* *Sept. 30,* *June 30,* *March 31,* *Dec 31,* *Sept. 30,*
*HISTORICAL EARNINGS SUMMARY*
*2021* *2021* *2021* *2020* *2020*
Interest income
$ 3,692 $ 3,806 $ 3,656 $ 3,177 $ 2,949
Interest expense
150 144 131 129 158
*Net Interest Income*
*3,542* *3,662* *3,525* *3,048* *2,791*
Service charges on deposits
56 58 56 61 56
Other income
111 104 91 90 86
*Total Non Interest Income*
*167* *162* *147* *151* *142*
Salaries and benefits expense
1,127 1,080 959 977 915
Occupancy and equipment expense
121 114 124 119 94
Other expense
430 405 505 362 364
*Total Non Interest Expense*
*1,678* *1,599* *1,588* *1,458* *1,373*
*Pretax pre-provision income*
*2,031* *2,225* *2,084* *1,741* *1,560*
Gain on sale of securities
(1 )
Gain on sale of foreclosed assets
18
Gain on sale of other assets
*Provision for Loan Losses*
*290* *550* *550* *315* *200*
Earnings before income taxes
1,741 1,675 1,534 1,425 1,378
Provision for income taxes
265 249 206 179 162
*Net Earnings*
*$* *1,476* *$* *1,426* *$* *1,328* *$* *1,246* *$* *1,216*
Diluted earnings per share
$ 1.30 $ 1.26 $ 1.18 $ 1.10 $ 1.08
TRINITY BANK N.A.
(Unaudited)
(Dollars in thousands, except per share data)
*Ending Balance*
*Sept. 30,* *June 30,* *March 31,* *Dec 31,* *Sept. 30,*
*HISTORICAL BALANCE SHEET*
*2021* *2021* *2021* *2020* *2020*
Total loans
$ 228,976 $ 215,085 $ 213,644 $ 205,355 $ 177,091
Total PPP loans
$ 20,911 $ 34,305 $ 56,975 $ 46,852 $ 51,382
Total short term investments
34,818 31,247 10,941 24,993 16,429
Total investment securities
117,844 100,499 93,615 95,244 90,606
*Total earning assets*
*402,549* *381,136* *375,175* *372,444* *335,508*
Allowance for loan losses
(4,306) (4,016) (3,466) (2,915) (2,598)
Premises and equipment
2,179 2,218 2,221 2,340 2,400
Other Assets
6,803 10,507 7,645 6,237 6,748
*Total assets*
*407,225* *389,845* *381,575* *378,106* *342,058*
Noninterest bearing deposits
148,238 149,049 135,920 134,692 114,284
Interest bearing deposits
214,162 196,355 202,205 201,120 186,096
*Total deposits*
*362,400* *345,404* *338,125* *335,812* *300,380*
Fed Funds Purchased and Repurchase Agreements
Other Liabilities
1,834 1,539 2,181 1,270 2,029
*Total liabilities*
*364,234* *346,943* *340,306* *337,082* *302,409*
Shareholders' Equity Actual
*41,465* *40,957* *39,352* *38,778* *37,463*
Unrealized Gain - AFS
*1,526* *1,945* *1,917* *2,246* *2,186*
*Total Equity*
*$* *42,991* *$* *42,902* *$* *41,269* *$* *41,024* *$* *39,649*
*Quarter Ending*
*Sept. 30,* *June 30,* *March 31,* *Dec 31,* *Sept. 30,*
*NONPERFORMING ASSETS*
*2021*
*2021*
*2021*
*2020*
*2020*
Nonaccrual loans
$ 279 $ 297 $ 321 $ 249 $ 266
Restructured loans
$ $ $ $ $
Other real estate & foreclosed assets
$ $ $ $ $
Accruing loans past due 90 days or more
$ $ $ $ $
*Total nonperforming assets*
*$* *279* *$* *297* *$* *321* *$* *249* *$* *266*
Accruing loans past due 30-89 days
$ 600 $ $ $ $
Total nonperforming assets as a percentage
of loans and foreclosed assets
0.12 % 0.12 % 0.13 % 0.10 % 0.12 %
TRINITY BANK N.A.
(Unaudited)
(Dollars in thousands, except per share data)
*Quarter Ending*
*ALLOWANCE FOR*
*Sept. 30,* *June 30,* *March 31,* *Dec 31,* *Sept. 30,*
*LOAN LOSSES*
*2021* *2021* *2021* *2020* *2020*
*Balance at beginning of period*
*$* *4,016* *$* *3,466* *$* *2,915* *$* *2,598* *$* *2,396*
Loans charged off
Loan recoveries
1 2 2
Net (charge-offs) recoveries
1 2 2
Provision for loan losses
290 550 550 315 200
*Balance at end of period*
*$* *4,306* *$* *4,016* *$* *3,466* *$* *2,915* *$* *2,598*
Allowance for loan losses
1.88 % 1.61 % 1.28 % 1.16 % 1.14 %
as a percentage of total loans
Allowance for loan losses net of PPP Loans
1.94 % 1.86 % 1.62 % 1.46 % 1.48 %
as a percentage of total loans
Allowance for loan losses
1543 % 1352 % 1080 % 1171 % 977 %
as a percentage of nonperforming assets
Net charge-offs (recoveries) as a
0.00 % 0.00 % 0.00 % 0.00 % 0.00 %
percentage of average loans
Provision for loan losses
0.13 % 0.21 % 0.21 % 0.13 % 0.09 %
as a percentage of average loans
*Quarter Ending*
*Sept. 30,* *June 30,* *March 31,* *Dec 31,* *Sept. 30,*
*SELECTED RATIOS*
*2021* *2021* *2021* *2020* *2020*
Return on average assets (annualized)
1.49 % 1.46 % 1.42 % 1.37 % 1.42 %
Return on average equity (annualized)
13.50 % 13.51 % 12.88 % 12.15 % 12.19 %
Return on average equity (excluding unrealized gain on investments)
14.15 % 14.18 % 13.56 % 12.85 % 12.94 %
Average shareholders' equity to average assets
10.54 % 10.28 % 10.49 % 10.48 % 10.99 %
Yield on earning assets (tax equivalent)
3.97 % 4.11 % 4.14 % 3.88 % 3.65 %
Effective Cost of Funds
0.16 % 0.14 % 0.15 % 0.28 % 0.19 %
Net interest margin (tax equivalent)
3.81 % 3.97 % 3.99 % 3.60 % 3.46 %
Efficiency ratio (tax equivalent)
43.3 % 40.5 % 41.4 % 44.8 % 50.4 %
End of period book value per common share
$ 39.66 $ 39.47 $ 38.11 $ 37.88 $ 36.61
End of period book value (excluding unrealized gain on investments)
$ 38.25 $ 37.68 $ 36.34 $ 35.81 $ 34.59
End of period common shares outstanding (in 000's)
1,084 1,087 1,083 1,083 1,083
TRINITY BANK N.A.
(Unaudited)
(Dollars in thousands, except per share data)
*Quarter Ending*
*September 30, 2021* *September 30, 2020*
Tax
Tax
Average
Equivalent Average
Equivalent
YIELD ANALYSIS
Balance Interest Yield Yield Balance Interest Yield Yield
Interest Earning Assets:
Short term investment
$ 25,716 13 0.20 % 0.20 % $ 32,176 10 0.12 % 0.12 %
FRB Stock
406 6 6.00 % 6.00 % 395 6 6.00 % 6.00 %
Taxable securities
423 0.00 % 0.00 % 0.00 % 0.00 %
Tax Free securities
113,491 640 2.26 % 2.86 % 91,877 600 2.61 % 3.31 %
Loans
249,472 3,033 4.86 % 4.86 % 216,454 2,333 4.31 % 4.31 %
*Total Interest Earning Assets*
*389,508* *3,692* *3.79* *%* *3.97* *%* *340,902* *2,949* *3.46* *%* *3.65* *%*
Noninterest Earning Assets:
Cash and due from banks
5,481 5,050
Other assets
4,915 4,518
Allowance for loan losses
(4,142) (2,449)
*Total Noninterest Earning Assets*
*6,254* *7,119*
*Total Assets*
*$* *395,762* *$* *348,021*
Interest Bearing Liabilities:
Transaction and Money Market accounts
156,631 95 0.24 % 0.24 % 143,006 35 0.10 % 0.10 %
Certificates and other time deposits
40,738 42 0.41 % 0.41 % 46,047 123 1.07 % 1.07 %
Other borrowings
10,000 13 0.52 % 0.52 % 0.00 % 0.00 %
*Total Interest Bearing Liabilities*
*207,369* *150* 0.29 % *0.29* *%* *189,053* *158* 0.33 % *0.33* *%*
Noninterest Bearing Liabilities:
Demand deposits
143,056 117,655
Other liabilities
1,607 1,411
Shareholders' Equity
43,730 39,902
*Total Liabilities and Shareholders Equity*
*$* *395,762* *$* *348,021*
*Net Interest Income and Spread*
*3,542* *3.50* *%* *3.68* *%* *2,791* *3.13* *%* *3.32* *%*
*Net Interest Margin*
*3.64* *%* *3.81* *%* *3.27* *%* *3.46* *%*
TRINITY BANK N.A.
(Unaudited)
(Dollars in thousands, except per share data)
*September 30*
*September 30*
*2021* *%* *2020* *%*
LOAN PORTFOLIO
Commercial and industrial
$ 122,482 49.01 % $ 91,279 39.95 %
PPP Loans
$ 20,427 8.17 % $ 50,100 21.93 %
Real estate:
Commercial
63,791 25.53 % 51,153 22.39 %
Residential
19,101 7.64 % 23,429 10.25 %
Construction and development
23,730 9.50 % 12,203 5.34 %
Consumer
356 0.14 % 309 0.14 %
*Total loans (gross)*
*249,887* *100.00* *%* *228,473* *100.00* *%*
Unearned discounts
0.00 % 0.00 %
*Total loans (net)*
*$* *249,887* *100.00* *%* *$* *228,473* *100.00* *%*
*September 30* *September 30*
*2021* *2020*
REGULATORY CAPITAL DATA
Tier 1 Capital
$ 41,464 $ 37,463
Total Capital (Tier 1 + Tier 2)
$ 44,640 $ 39,890
Total Risk-Adjusted Assets
$ 252,968 $ 194,025
Tier 1 Risk-Based Capital Ratio
16.39 % 19.31 %
Total Risk-Based Capital Ratio
17.65 % 20.56 %
Tier 1 Leverage Ratio
10.48 % 10.76 %
OTHER DATA
Full Time Equivalent
Employees (FTE's)
22 23
Stock Price Range
(For the Three Months Ended):
High
$ 75.00 $ 70.00
Low
$ 73.50 $ 57.50
Close
$ 75.00 $ 64.00
*SOURCE: *Trinity Bank N.A.
View source version on accesswire.com:
https://www.accesswire.com/669948/Trinity-Bank-Reports-2021-3rd-Quarter-Net-Income-Of-1476000